UX Research · Design · Full-stack development
AwareHome SmartBathroom Dashboard
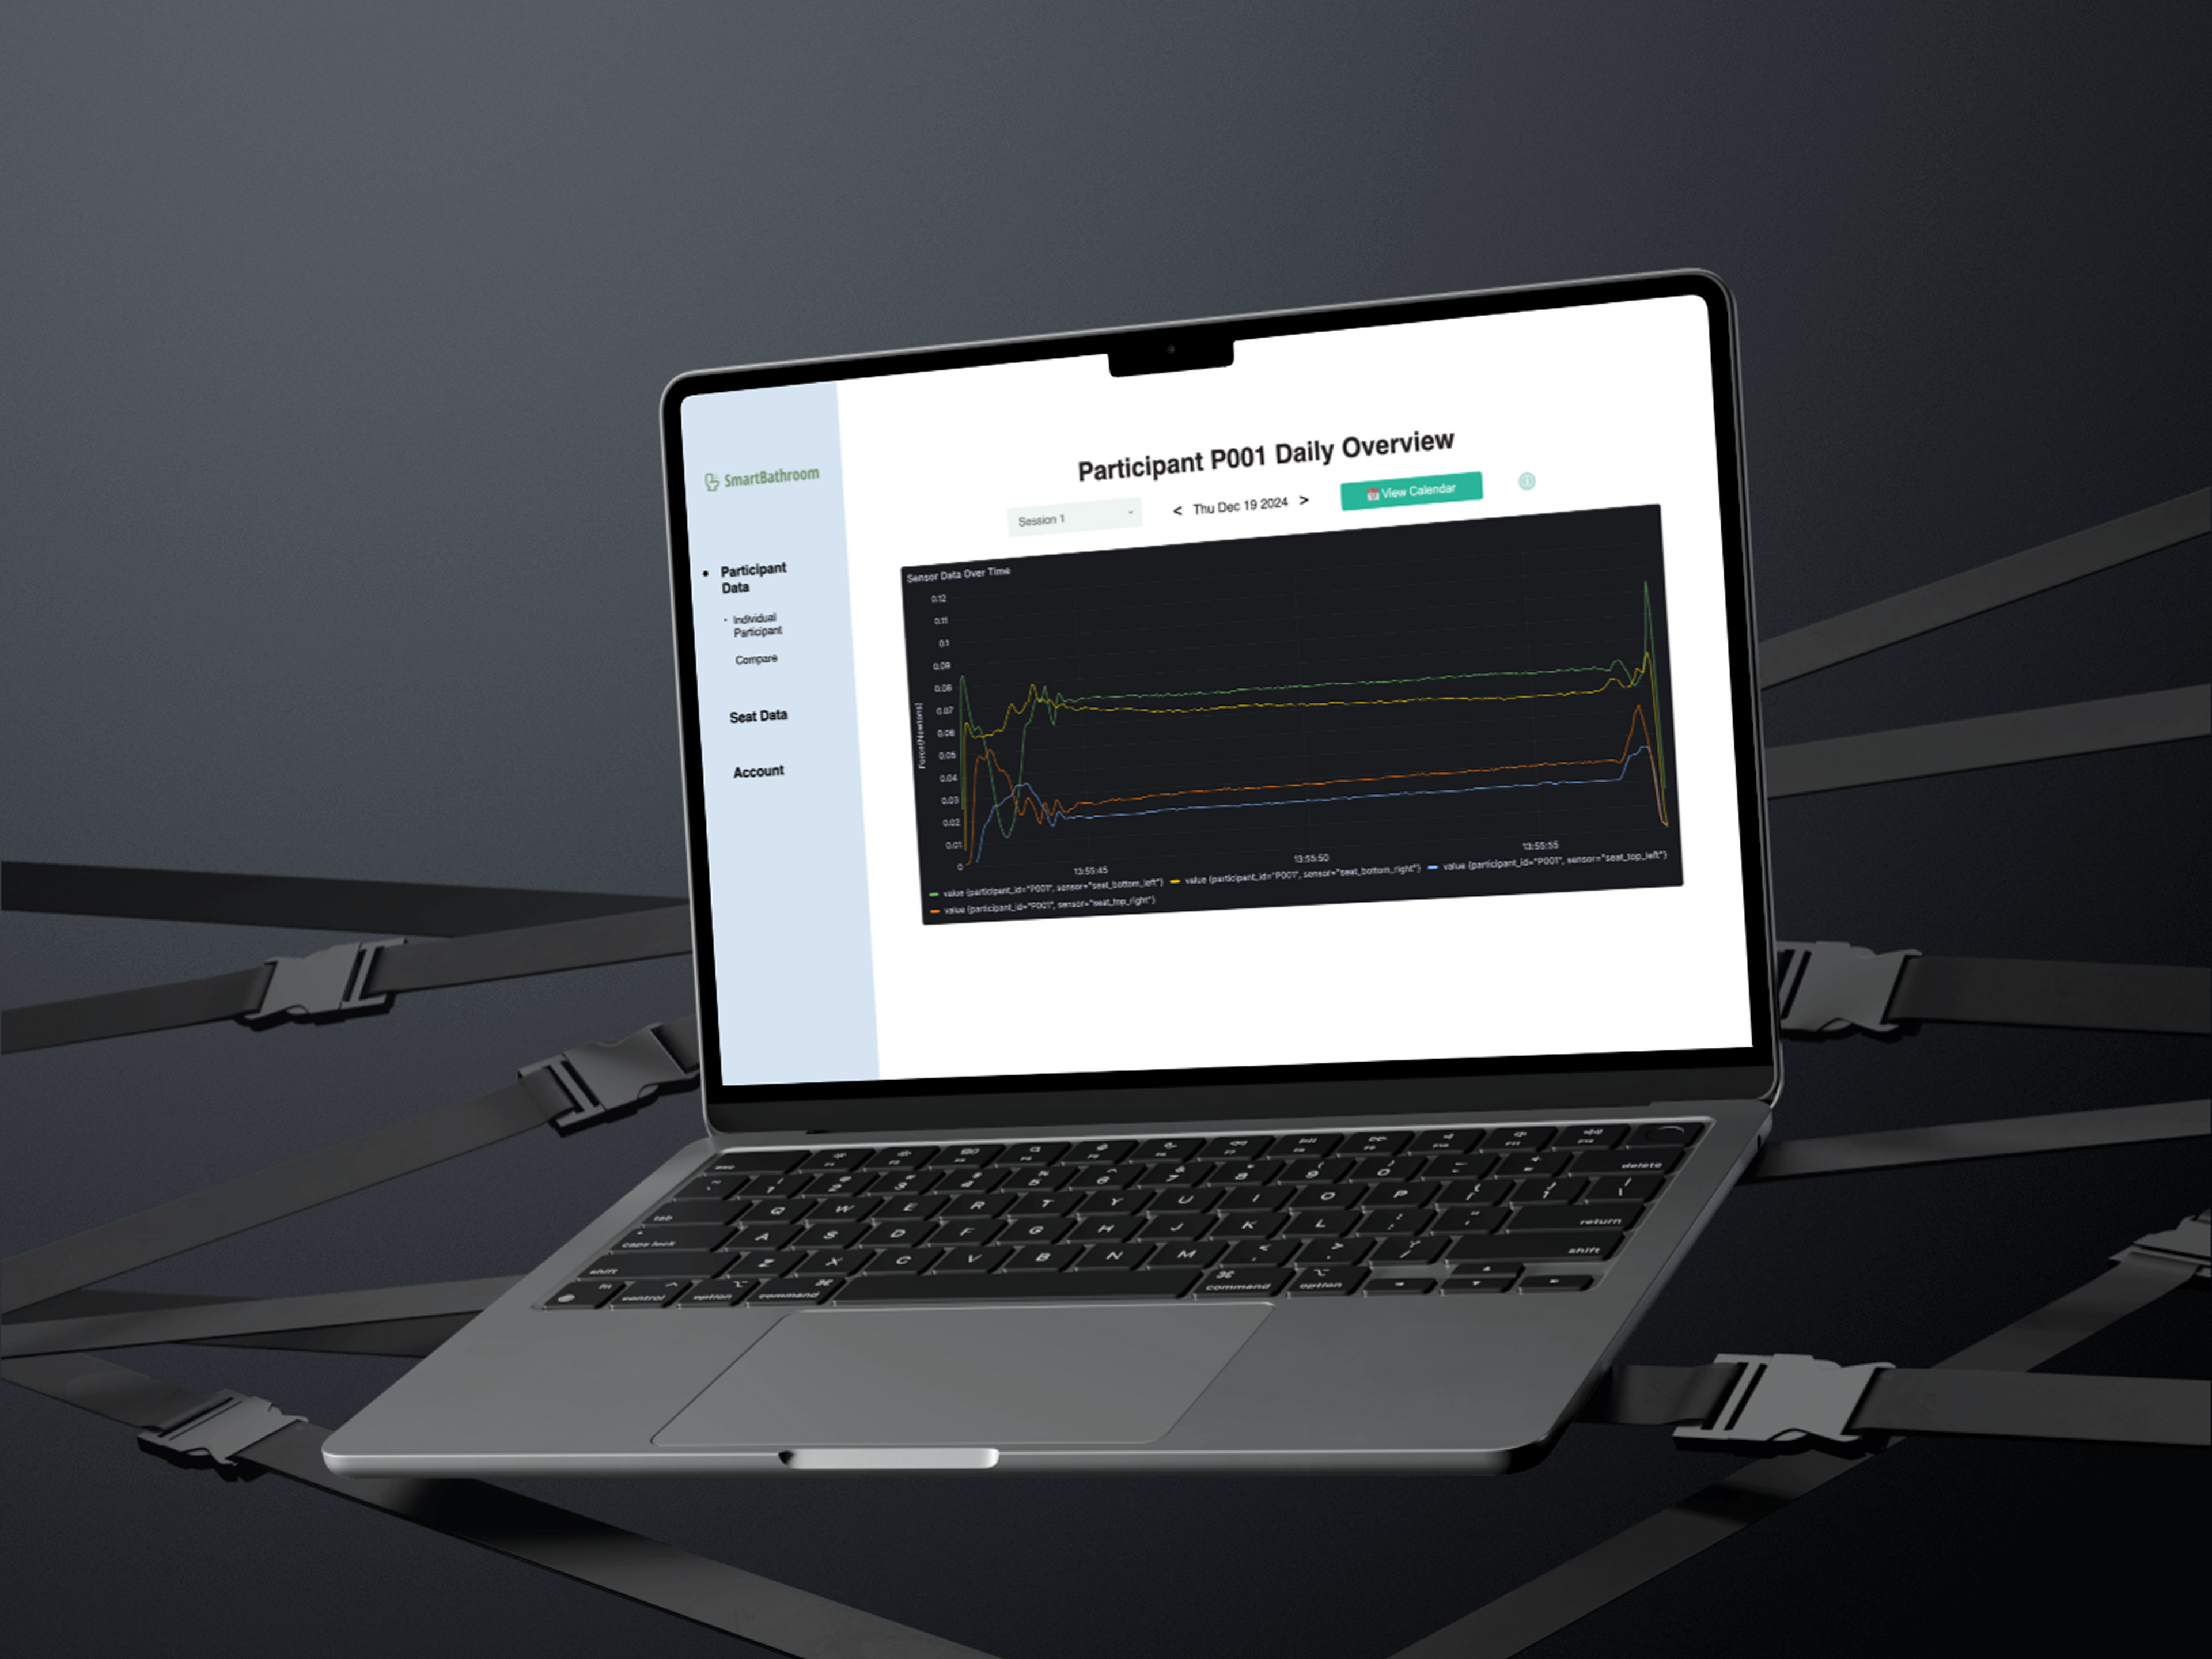
A dashboard that lets occupational therapists easily view live and historical bathroom sensor data, organized by participants, homes, and studies.
overview
- Role
- UX Researcher & Systems Designer
- Team
- TODO(nathan): team size and who you worked with (e.g. project lead Jon Sanford)
- Timeline
- May 2024 – Aug 2025
- Tools
- React, Flask, InfluxDB, Home Assistant, Grafana, Raspberry Pi
the problem
The bathroom is central to independence, yet age-related changes make daily tasks harder. To study these challenges, our team embedded four sensors under the toilet seat to capture data from older adults (60+) with physical impairments. Occupational therapists needed a dashboard to track this data over time, viewing both live and historical information across participants, homes, and studies.
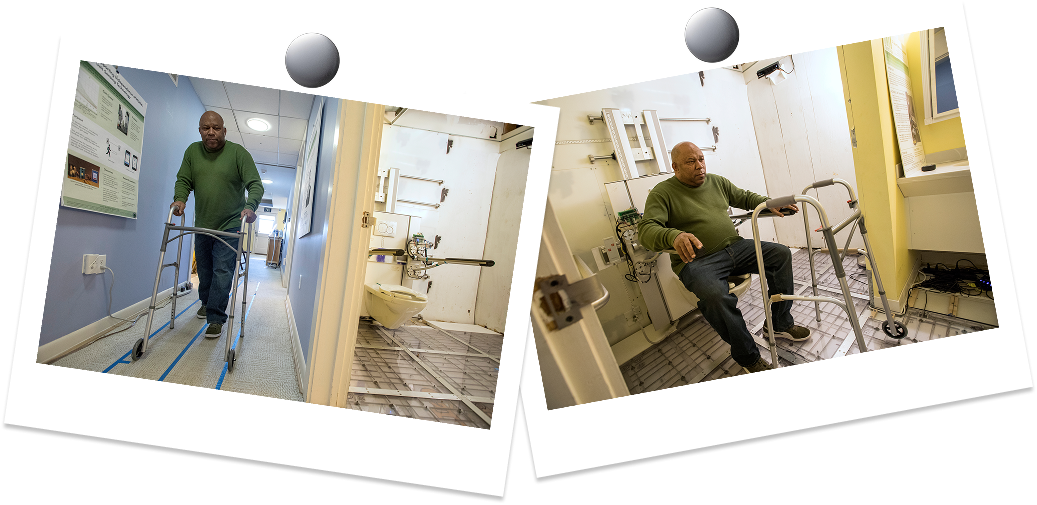
How might we design a solution that enables occupational therapists to easily view, interpret, and act on pressure sensor data collected from participants?
Occupational therapists lacked a centralized tool to visualize seat sensor data, making it difficult to monitor participants, compare across homes and studies, or generate insights for care.
research
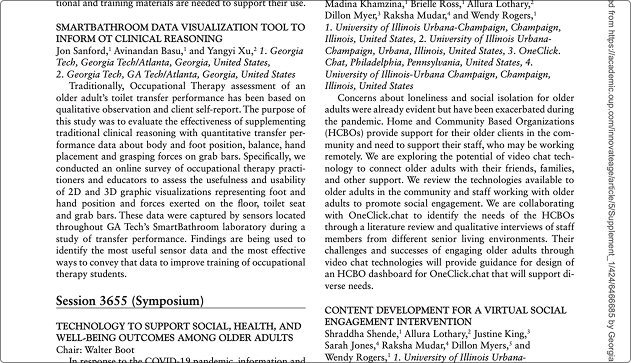
Effort 1: Literature review & conversations. I reviewed past AwareHome projects and spoke with project lead Jon Sanford to understand recurring challenges. A key issue identified was the difficulty of controlling and accessing historical sensor data. The goal was to ground the project in existing research and uncover therapist pain points around messy, inaccessible data.
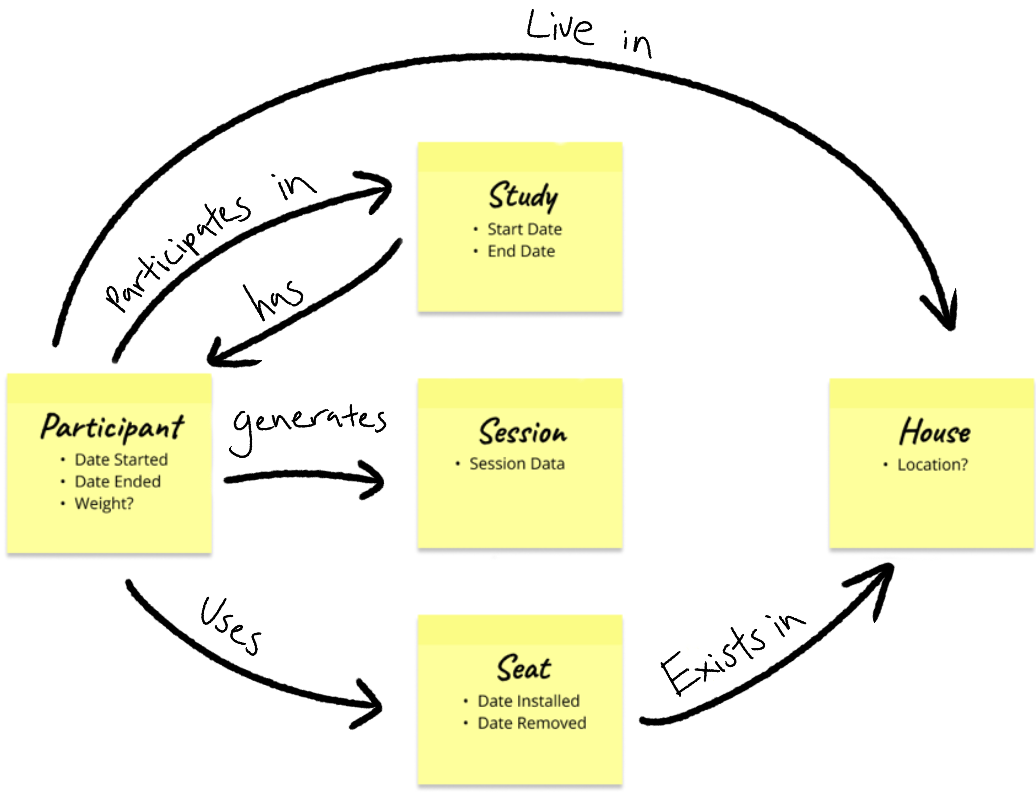
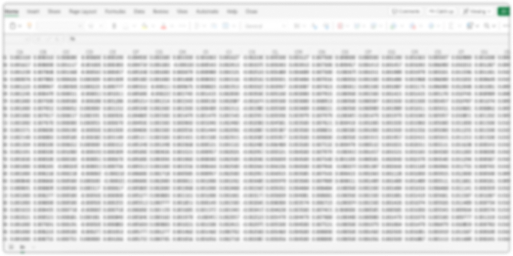
Effort 2: Defining the data structure. I designed a clear, flexible data model that organizes sensor data and supports navigation between levels of participant, home, study, and seat, ensuring scalability with essential metadata.
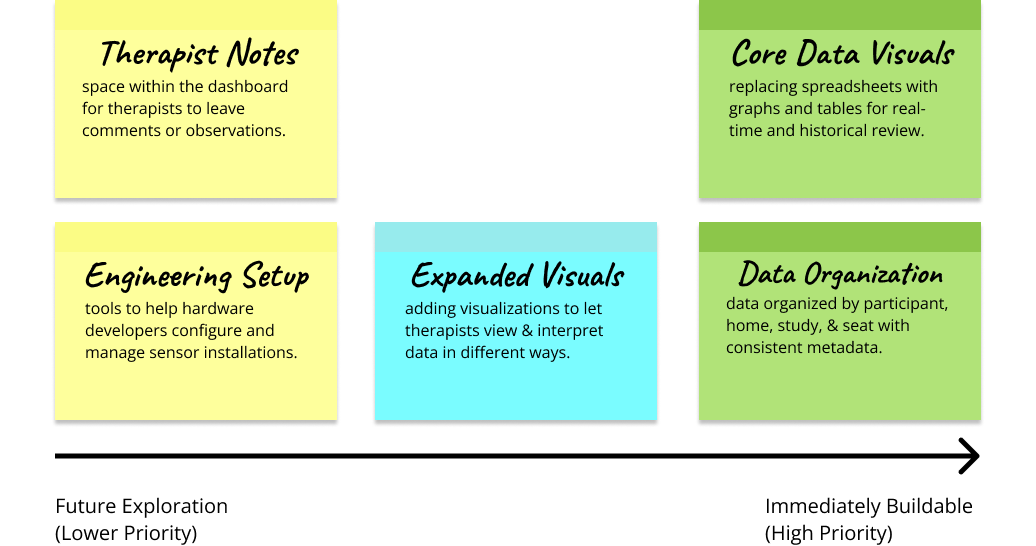
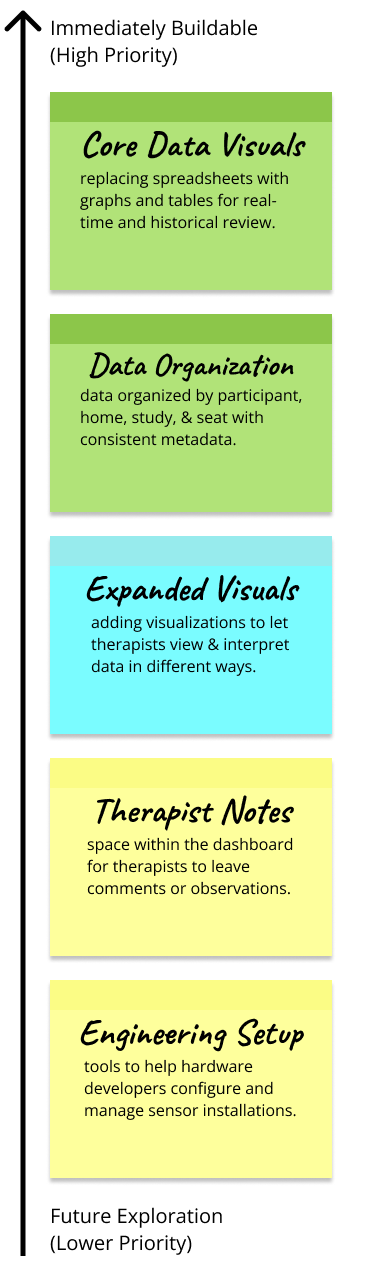
Scoping. Through our research, we scoped the project by prioritizing data organization and core visualizations as immediate needs for therapists, while identifying additional features.
- Methods
- Literature reviewStakeholder conversationsTherapist interviewsData modelingScoping
- Participants
- 8 occupational therapists across 3 testing cycles
Key insights
Data access
Controlling and accessing historical sensor data was a recurring challenge.
Therapist pain points centered on messy, inaccessible data.
Structure
Navigate between participant, home, study, and seat.
Keep essential metadata like start and end dates for traceability.
Priorities
Data organization and core visualizations are the immediate needs.
Additional features were identified for later phases.
design process
Sketch
TODO(nathan): add an early sketch of the dashboard (paper or FigJam).
Iteration 1 · House-centric
Iteration 2 · Participant-centric
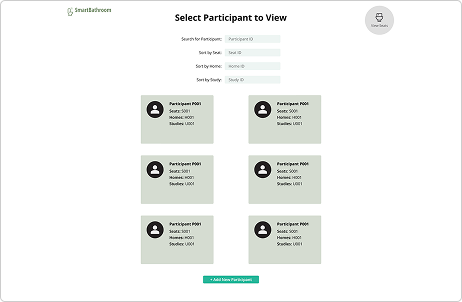
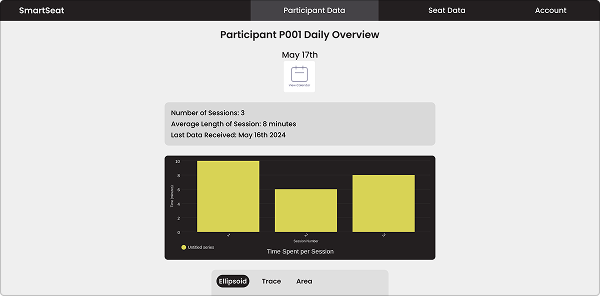
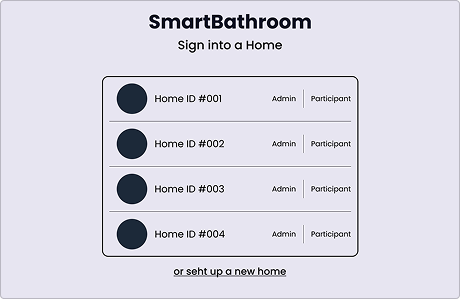
The view. A participant-centered view makes metadata easy to access. Originally designed around homes, the first view assumed therapists needed direct visibility into each home. However, it limited their ability to focus on individuals and their specific data.
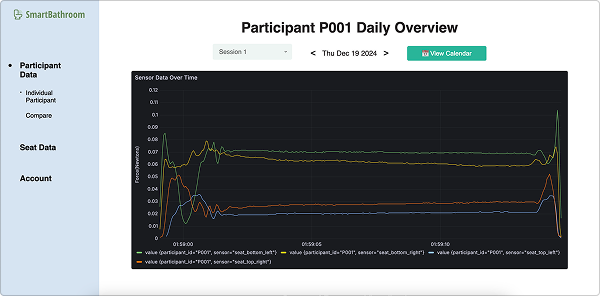
The dashboard. A sidebar layout surfaces key graphs upfront. The first version stacked information vertically, forcing therapists to scroll before reaching the graphs they needed most, which buried critical insights under less relevant details.
Feature 1: Metadata management. Therapists can easily manage participant metadata, including study details, start and end dates, and other key attributes. This feature was designed to reduce the clutter and inconsistencies of raw sensor data, giving therapists a clean and reliable way to keep records up to date.
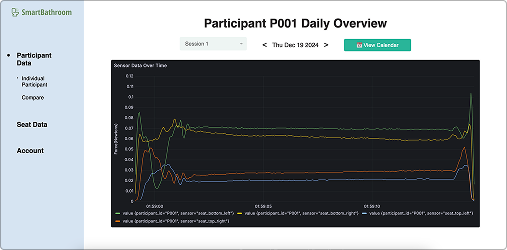
Feature 2: Data filtering. Therapists can use a calendar to filter by day and sort through individual seat sessions. Each instance is linked to an interactive Grafana-powered graph, making it easy to explore both current and historical data by zooming and clicking data points.
Feature 3: Compare data. Therapists can compare data across participants, sessions, or homes to identify patterns and anomalies. This comparative view was designed to help therapists make informed decisions more quickly, without needing to manually align spreadsheets or charts.
development
System architecture. Seat sensors stream data into a local InfluxDB instance on the Raspberry Pi, which syncs to a secure InfluxDB Cloud bucket. From there, a Flask API organizes and exposes the data, Grafana renders it into interactive charts, and the React dashboard embeds those charts for therapists, ensuring both real-time and historical data are accessible.
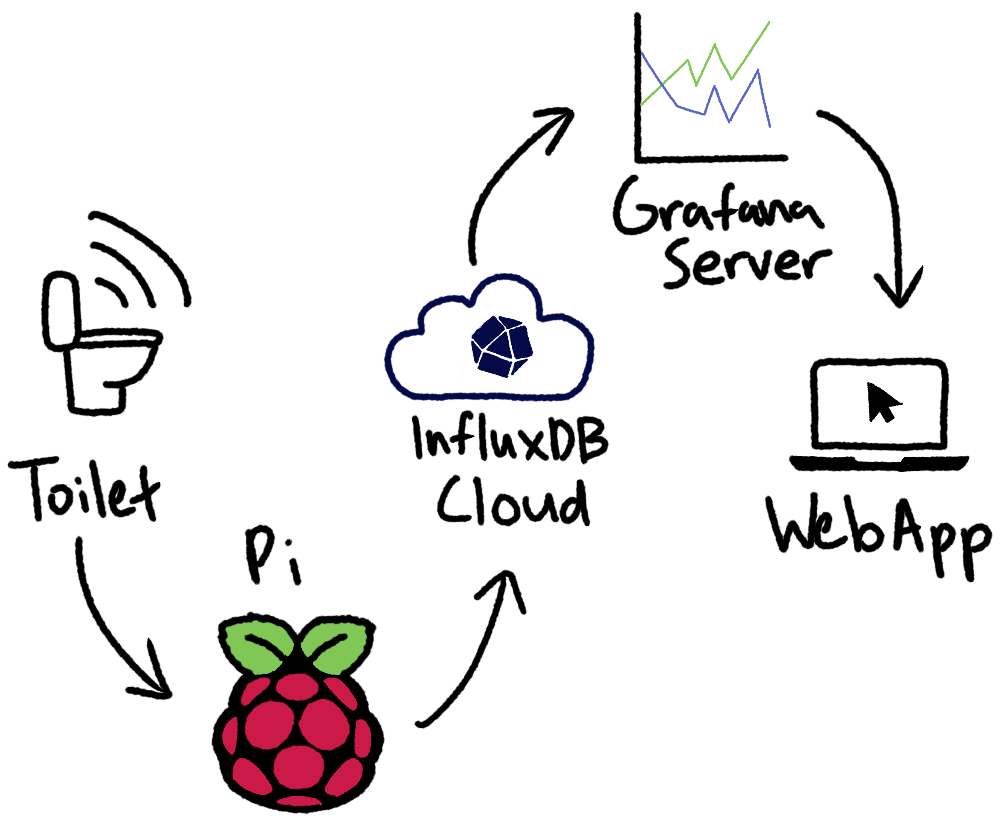
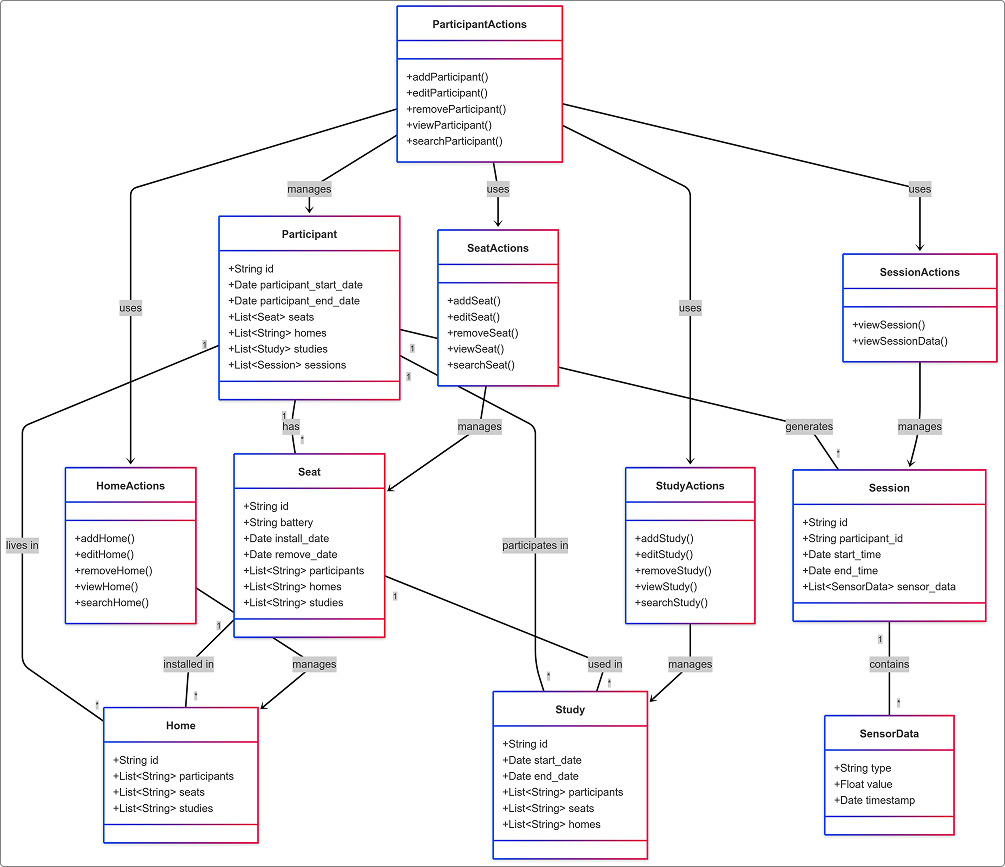
Data flow. To support this pipeline, I designed a relational data model connecting Participants, Seats, Homes, Studies, and Sessions, with metadata like start/end dates for traceability. The diagrams illustrate how data flows through the system and how functions interact to keep relationships consistent and scalable.
outcome
- occupational therapists interviewed
- 8
- testing cycles
- 3
- RESTful endpoints designed and built
- 20+
Solution
We created a dashboard that lets occupational therapists easily view live and historical bathroom sensor data, organized by participants, homes, and studies.
Impact for users
Therapists gained a clearer, more efficient way to track challenges and tailor interventions for older adults.
Impact for team
Our team learned how to bridge research, design, and development to deliver a clinically useful tool.
reflection
Future work includes deploying seats in participant homes at scale and expanding the dashboard with additional features for therapists and engineers, such as richer note-taking, alternative visualizations, or sensor setup tools. Getting the system hosted on Georgia Tech's servers was a long and challenging process, but it ensures that anyone continuing this project will have a much easier time building on top of our work.
I'm proud of how we got the groundwork running and excited to see how this platform can continue to grow in both technical capability and real-world impact.